Google handed you an AI Overview report in Search Console. Most people will read it wrong.
6 min read
TL;DR: Search Console’s new generative-AI performance report shows impressions in AI Overviews and AI Mode, with no click data at all. Read alone, it is a vanity number. Joined against the classic Performance report on URL, it becomes the most honest prioritization tool AEO has had yet: a list of pages that rank in blue links but never get chosen by AI. Here is that workflow.
On June 3, Google introduced Search Generative AI performance reports in Search Console: dedicated reporting for how often your URLs appear inside AI Overviews, AI Mode, and generative AI features in Discover. Data starts from May 18, 2026. Breakdowns cover pages, countries, devices, and dates, down to hourly granularity.
And there is no click column. None.
I work on AI-search visibility for a living, and I have wanted this report for two years. I am also fairly sure most teams will do exactly one thing with it: screenshot the impressions trend, paste it into a quarterly deck next to an up-and-to-the-right arrow, and move on. That would waste the most useful thing Google has shipped for answer-engine work so far. The value is not in the report. It is in the join.
What the report gives you, and what it withholds
The concrete facts first, because the limitations define the workflow:
| The report has | The report does not have |
|---|---|
| Impressions in AI Overviews, AI Mode, and gen-AI Discover features | Clicks, of any kind |
| Page, country, and device breakdowns | History before May 18, 2026 |
| Dates from hourly to monthly granularity | Full availability (rollout started limited, expanding in waves) |
The missing click column is being read as a flaw. I read it as an honest admission: a URL “appearing in” an AI answer is not a visit and mostly never becomes one. Google declining to invent a click metric for a surface that does not produce clicks is more candor than the analytics industry usually offers. But it has a consequence: this report cannot measure outcomes, only selection. It tells you whether the machine picks you, not whether the machine sends you anyone.
A number with no outcome attached is exactly the kind of number that gets misused in board decks. If you take one sentence from this essay: raw AI impressions are a diagnostic input, not a KPI. I wrote about what the 9x conversion stat hides when vendors sell AI-search dashboards; do not build the same distortion into your own reporting for free.
The workflow: two reports, one join
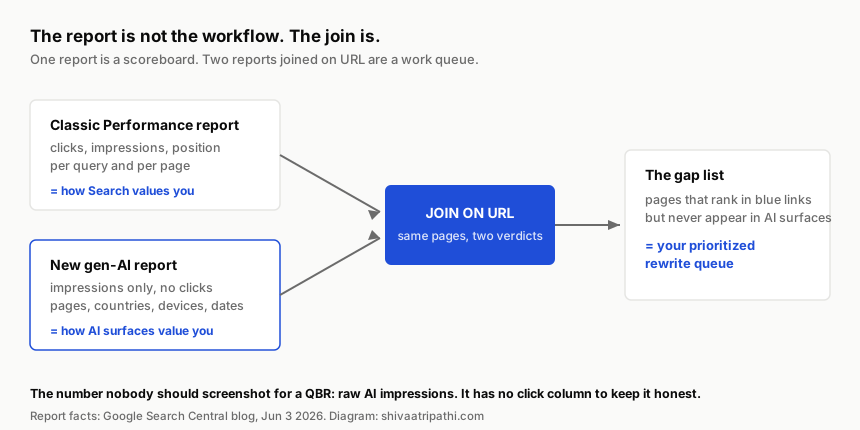
The classic Performance report tells you how Search values a page: impressions, clicks, average position, per query and per URL. The new report tells you how AI surfaces value the same page: chosen or not chosen. Neither is interesting alone. Joined on URL, they classify every page you have into four states, and each state has exactly one correct response.
Here is the mechanical version, doable in a spreadsheet in under an hour:
- Export both. Classic Performance report: pages, filtered to the last 28 days, with impressions, clicks, and position. Gen-AI report: pages and impressions, same window. (API and bulk export land the same data if you prefer; the join key is the URL either way.)
- Join on URL. A VLOOKUP is enough. Every page now has two numbers: classic impressions and AI impressions.
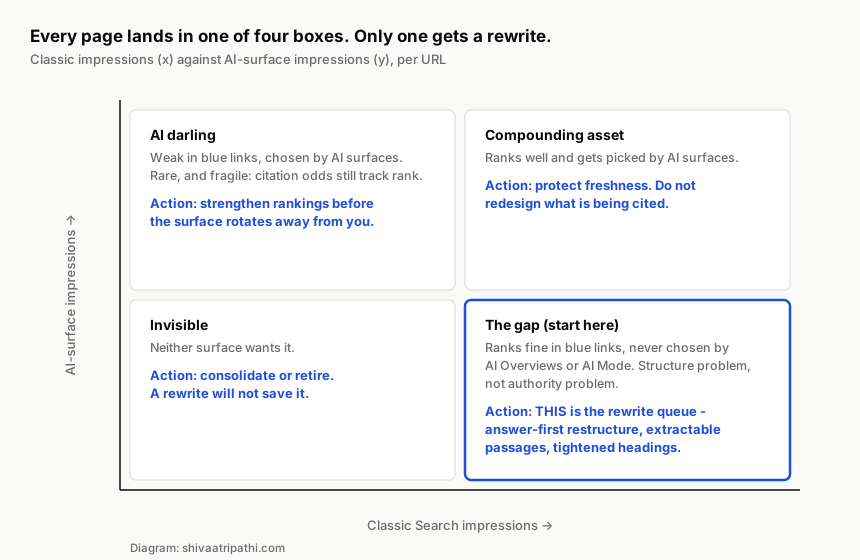
- Bucket into four quadrants. Set thresholds honestly for your traffic scale - “meaningful classic impressions” might be 1,000 for a niche B2B blog and 100,000 for a marketplace.
- Work one quadrant. Only one of the four is a content-work queue. The others are a protect list, a strengthen list, and a retirement list.
Why the gap quadrant is the one that pays
The interesting box is bottom-right: pages with healthy blue-link visibility that AI surfaces never choose. This combination is information. It rules out the explanation everyone reaches for first.
If a page did not rank at all, its absence from AI Overviews would tell you nothing: iPullRank’s analysis of roughly 79,000 query-URL pairs found that traditional ranking position remains the gatekeeper for AI citations, with citation likelihood dropping sharply outside the top results. Ranking is the entry ticket. So when a page holds the ticket and still never gets picked, authority is not the problem. Structure is. The page ranks on signals that survive at document level - links, topical authority, history - while failing at what answer engines need at passage level: an extractable claim, a direct answer near the top, headings that scope sections cleanly, facts that stand alone when lifted out of context.
That is a rewrite brief, and an unusually precise one. You are not “doing AEO” across the whole site on faith. You are restructuring a named list of pages where the only missing ingredient is extractability, which is the best return on content work available to you this quarter.
When a page holds the ranking ticket and still never gets picked, authority is not the problem. Structure is.
The other three boxes, briefly. Top-right pages (chosen and ranking) get freshness maintenance and protection from redesign enthusiasm; being currently cited is a moat you can accidentally fill in. Top-left pages (AI darlings without rankings) are rarer than LinkedIn threads suggest, and fragile - given how strongly citations track rank, shore up the ranking before the surface rotates. Bottom-left pages are invisible to both worlds; consolidate or retire them, because a rewrite cannot rescue a page nobody ranks or picks.
Watch the split, not just the level
One more discipline while you are in there: AI Overviews and AI Mode are different surfaces that reward different content, and they are moving in different directions. Kevin Indig’s Growth Memo tracking through late June showed AI Overview mentions declining slightly while AI Mode grew more than seven times faster in the same window, and the biggest platforms on the web simultaneously gained classic visibility while losing AI mentions. Surfaces rotate. If you track one blended “AI visibility” number, a rotation reads as a mysterious dip. In your join, keep the report’s date dimension and watch the trend per surface as availability expands - the report is also your early-warning system, at hourly granularity, for the next rotation.
Set up this month, even if you saw it and shrugged
Because the report only holds data from May 18, 2026 forward, every week you ignore it is history you never get back. Even if you do nothing else from this essay: open the report once, confirm your property has data, and export a baseline. The join can wait a month. The baseline cannot.
The report is free, first-party, and already sitting in a tool your team opens weekly. The vendors selling AI-visibility dashboards now have a benchmark to beat, and your first hour with a spreadsheet sets that bar surprisingly high.