When buyers stop clicking, what do you show the board?
5 min read
TL;DR: Marketing’s accountability model was built on clicks, and buyers are clicking less every quarter. The diagnosis is everywhere; the replacement reporting is not. Build three layers now: a mandatory self-reported source field, recognition deltas against a pre-AI baseline, and outcome cohorts by first-known source. Owned by RevOps, not marketing.
In April, Forrester’s Ross Graber published a line that should have ended a lot of QBR decks: “Eight of the top 12 criteria on which leaders judge B2B marketing are built upon proof of engagement.” Sessions, MQLs, click-through rates, downloads. Then he described the problem with them: buyers are getting their answers inside AI engines and never arriving on your property, so the proof vanishes while the helping continues. Marketing leaders in his conversations were already reporting traffic and demand-volume declines of 20 to 30 percent.
That post diagnosed the crisis well. It did not prescribe the replacement, and six months later almost nobody has. The discourse moved from “traffic is down” to “what do I tell my CFO” and stalled there. I have walked into the room where that question gets asked, with the numbers pointing the wrong way, so this is the essay I wanted to read in April.
The scorecard is measuring the wrong decade
Look at a typical B2B marketing board slide. Website sessions. MQL volume. CTR. Cost per lead. Content downloads. Form fills. Each one is a click a buyer made on something you own. That was a reasonable proxy for influence when the buying journey ran through your website, and it is now a proxy for a shrinking behavior.
The zero-click share of Google searches in the US hit 68 percent in early 2026, up from 60 percent two years earlier. MarTech’s survey of B2B tech marketing leaders found 52 percent now name AI-generated search as their top channel for reaching buyers. Put those together and the engagement scorecard has a structural bias: it reads as failure precisely while the buyer is being well served, because the service happened somewhere you cannot see.
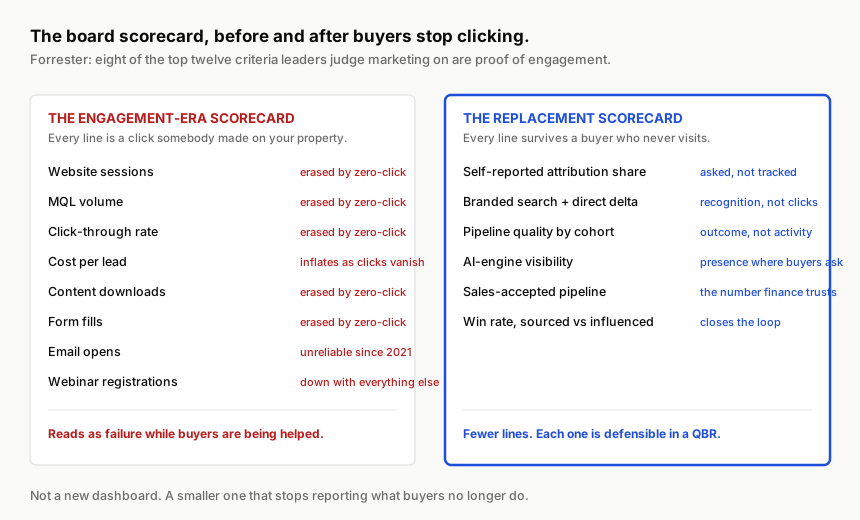
Cost per lead deserves special mention because it fails in the most misleading direction. As clicks decline, leads decline faster than spend, so CPL rises and the slide says marketing got less efficient. Nothing got less efficient. The denominator moved to a place the pixel cannot follow. I wrote about why chasing more content volume is the wrong response to this; the reporting response is the other half.
What survives a buyer who never visits
The test for every line on the replacement scorecard is simple: does this number still exist if the buyer researched you entirely inside ChatGPT, a peer’s LinkedIn post, and a Slack community, then typed your name into Google and booked a demo? Six things pass.
Self-reported attribution share. Ask the buyer. A mandatory free-text “how did you hear about us” at demo request and trial start, coded weekly into a fixed source list. The buyer who never clicked will tell you “an AI search,” “a post from someone at X,” “my CTO mentioned you.” No pixel ever captured that; a text field does.
Branded search and direct traffic, as deltas. When recognition grows, people type your name. Branded query volume and direct sessions are the two traffic numbers that still correlate with influence, because they measure a buyer arriving already knowing who you are. Report them as change against a baseline quarter, not as absolute counts.
Pipeline quality by cohort. Take this quarter’s AI-sourced or self-reported-sourced opportunities and compare them to last year’s paid-search cohort at the same stage and age: sales acceptance rate, velocity, win rate, deal size. Quality cohorts answer the question the board actually has, which is whether the money produced buyers who buy.
AI-engine visibility. Whether your name appears when an engine is asked your category’s questions. Imperfect, rented, and still worth a line, because it is the leading indicator for the branded search that follows.
Sales-accepted pipeline and win rate, sourced versus influenced. The two numbers finance already trusts, now cut by first-known source so marketing’s contribution is legible in the ledger the CFO reads anyway.
The test for every line on the scorecard: does this number still exist if the buyer never visited your website before booking the demo?
The three-layer stack
Reporting changes do not survive on good intentions; they survive on plumbing. Here is the build order I would use, with a deliberate owner.
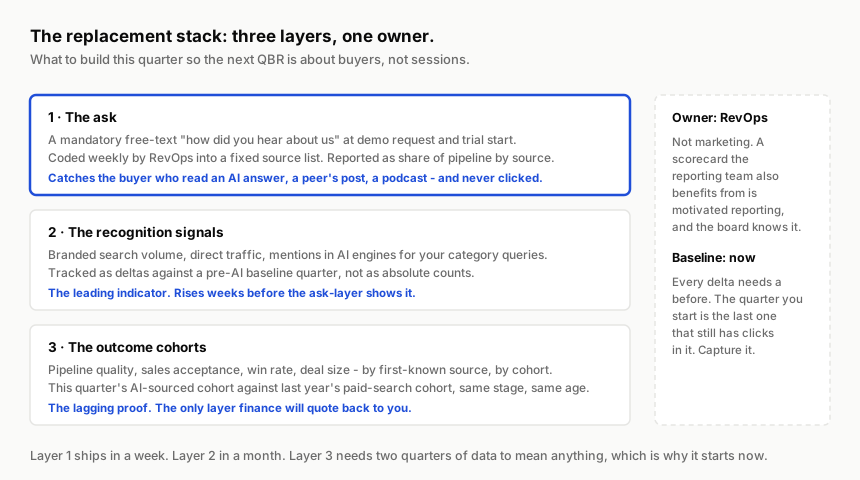
Layer one, the ask, ships in a week. Add the field. Make it mandatory. Give RevOps a 12-item source list and a weekly half hour to code the free text. Within a quarter you have a share-of-pipeline-by-source chart that includes the sources no tool can see.
Layer two, the recognition signals, takes a month. Search Console for branded queries, analytics for direct, a weekly spot-check of AI engines on your five category questions. I described how to instrument AI referrals cheaply before buying tooling; the same discipline applies here. The critical move is the baseline: the quarter you start is the last one that still has normal click volume in it. Freeze it.
Layer three, the outcome cohorts, needs two quarters of data to mean anything. Which is exactly why the first two layers cannot wait. Cohort analysis of AI-era sourcing against paid-era sourcing is the single most persuasive artifact you will ever put in front of a board, and it is impossible to produce retroactively.
Owner: RevOps, not marketing. This is the part marketing leaders resist and should not. A scorecard built and reported by the team it evaluates is motivated reporting, and every board member knows it. Hand the coding, the baseline, and the cohort cuts to RevOps. You lose a little control and gain the one thing the engagement scorecard never had, which is credibility when the numbers are good.
What to say in the room
The QBR sentence I would open with: “Buyers are doing their research where we cannot see it, so we are replacing the metrics that depended on seeing it. Here is the new scorecard, here is the baseline we froze, and here is what the first cohort shows.” Then show fewer numbers than last quarter, each one defensible.
The engagement era gave marketing a great gift and a slow poison: metrics that were easy to grow and easy to show. AI search is taking both away at once. The leaders who treat that as a reporting problem will rebuild their scorecard in a quarter. The ones who treat it as a traffic problem will spend the year explaining a decline that is not a decline. The buyer did not stop buying. They stopped clicking. Measure the buying.